 DGS
DGS Leichte Sprache

Eisstadion
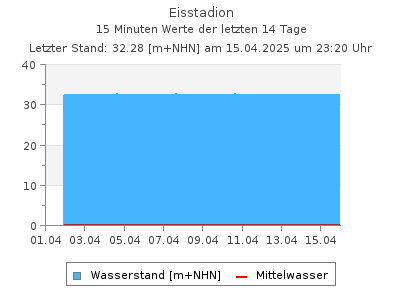
Aktuelle Wasserstände als Tabelle
Letzter Tagesmittelwert (02.08.2026): 41,0 cmWasserstände W in cm im Intervall von 2 Stunden (in MEZ), Quelle: Land Berlin
| 00:00 | 02:00 | 04:00 | 06:00 | 08:00 | 10:00 | 12:00 | 14:00 | 16:00 | 18:00 | 20:00 | 22:00 | |
|---|---|---|---|---|---|---|---|---|---|---|---|---|
| 02.08.2026 | 41,0 | 41,0 | 40,9 | 40,8 | 40,4 | 40,2 | 40,1 | 39,8 | - | - | - | - |
| 01.08.2026 | 38,3 | 38,4 | 38,4 | 88,7 | 68,4 | 56,0 | 48,9 | 45,7 | - | 42,5 | 41,6 | 41,0 |
| 31.07.2026 | 38,4 | 38,5 | 13,1 | 36,1 | 36,3 | 36,4 | 36,1 | 35,8 | 38,2 | 37,7 | 37,9 | 38,0 |
| 30.07.2026 | 38,3 | 38,5 | 8,70 | 36,2 | 36,4 | 36,2 | 36,2 | 36,0 | 38,0 | 37,9 | 38,0 | 38,3 |
| 29.07.2026 | 38,6 | 38,6 | 9,10 | 36,3 | 36,8 | 36,3 | 35,8 | 35,8 | 38,1 | 37,8 | 37,9 | 38,0 |
| 28.07.2026 | 37,1 | 37,1 | 8,70 | 33,7 | 33,7 | 33,8 | 36,4 | 36,8 | 39,0 | 38,6 | 38,5 | 38,4 |
| 27.07.2026 | 44,5 | 57,4 | 42,3 | 42,3 | 38,4 | 36,2 | 35,0 | 35,2 | 37,6 | 37,3 | 37,2 | 37,0 |
| 26.07.2026 | 36,1 | 36,3 | 36,4 | 36,5 | 36,4 | 36,5 | 36,3 | 36,3 | 36,1 | 37,0 | 36,6 | 36,7 |
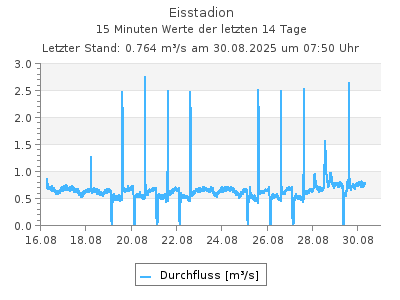
Aktuelle Abflüsse als Tabelle
Letzter Tagesmittelwert (02.08.2026): 0,850 m3/sAbflüsse Q in mł/s im Intervall von 2 Stunden (in MEZ), Quelle: Land Berlin
| 00:00 | 02:00 | 04:00 | 06:00 | 08:00 | 10:00 | 12:00 | 14:00 | 16:00 | 18:00 | 20:00 | 22:00 | |
|---|---|---|---|---|---|---|---|---|---|---|---|---|
| 02.08.2026 | 0,838 | 0,821 | 0,809 | 0,847 | 0,805 | 0,794 | 0,836 | 0,721 | - | - | - | - |
| 01.08.2026 | 0,646 | 0,612 | 0,631 | 7,90 | 3,69 | 2,16 | 1,49 | 1,18 | - | 0,929 | 0,912 | 0,852 |
| 31.07.2026 | 0,577 | 0,646 | 0,085 | 0,459 | 0,484 | 0,489 | 0,468 | 0,460 | 0,645 | 0,612 | 0,597 | 0,630 |
| 30.07.2026 | 0,637 | 0,626 | 0,063 | 0,527 | 0,499 | 0,473 | 0,469 | 0,471 | 0,621 | 0,613 | 0,591 | 0,620 |
| 29.07.2026 | 0,629 | 0,633 | 0,000 | 0,502 | 0,508 | 0,490 | 0,475 | 0,463 | 0,646 | 0,582 | 0,651 | 0,595 |
| 28.07.2026 | 0,521 | 0,507 | 0,014 | 0,369 | 0,338 | 0,365 | 0,513 | 0,514 | 0,658 | 0,678 | 0,638 | 0,644 |
| 27.07.2026 | 1,09 | 2,22 | 0,893 | 0,884 | 0,581 | 0,489 | 0,424 | 0,409 | 0,571 | 0,544 | 0,529 | 0,545 |
| 26.07.2026 | 0,459 | 0,468 | 0,448 | 0,486 | 0,475 | 0,481 | 0,449 | 0,462 | 0,466 | 0,535 | 0,479 | 0,484 |
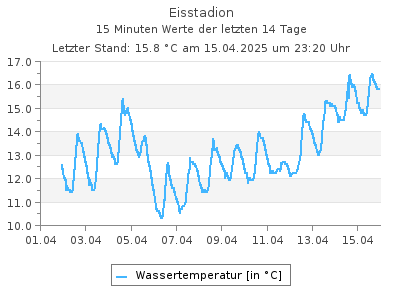
Aktuelle Wassertemperaturen als Tabelle
Letzter Tagesmittelwert (02.08.2026): 20,0 °CWassertemperaturen in °C im Intervall von 2 Stunden (in MEZ), Quelle: Land Berlin
| 00:00 | 02:00 | 04:00 | 06:00 | 08:00 | 10:00 | 12:00 | 14:00 | 16:00 | 18:00 | 20:00 | 22:00 | |
|---|---|---|---|---|---|---|---|---|---|---|---|---|
| 02.08.2026 | 20,0 | 19,8 | 19,5 | 19,3 | 19,3 | 19,5 | 20,3 | 20,3 | - | - | - | - |
| 01.08.2026 | 22,8 | 22,5 | 22,2 | 20,9 | 20,6 | 20,5 | 20,5 | 20,7 | - | 20,6 | 20,4 | 20,3 |
| 31.07.2026 | 22,9 | 22,5 | 21,9 | 21,9 | 21,8 | 21,9 | 22,4 | 23,2 | 23,8 | 23,5 | 23,2 | 23,0 |
| 30.07.2026 | 21,0 | 20,6 | 20,1 | 20,2 | 20,1 | 20,3 | 21,3 | 22,5 | 23,6 | 23,2 | 23,0 | 22,9 |
| 29.07.2026 | 19,7 | 19,5 | 19,1 | 19,1 | 19,1 | 19,2 | 19,6 | 20,7 | 21,8 | 21,3 | 21,1 | 21,0 |
| 28.07.2026 | 19,1 | 18,8 | 18,4 | 18,4 | 18,3 | 18,4 | 18,9 | 19,5 | 20,0 | 19,8 | 19,8 | 19,8 |
| 27.07.2026 | 19,8 | 19,2 | 18,8 | 18,6 | 18,7 | 18,9 | 19,3 | 19,7 | 20,1 | 19,8 | 19,4 | 19,3 |
| 26.07.2026 | 20,4 | 20,1 | 19,7 | 19,5 | 19,6 | 19,9 | 20,4 | 20,6 | 20,7 | 20,5 | 20,3 | 20,1 |
| Messstellennummer | 5867601 |
|---|---|
| Messstellenname | Eisstadion |
| Gewässer | Panke |
| Betreiber | Land Berlin |
| Messstellenausprägung | Wasserstand und Durchfluss |
| Flusskilometer | |
| Pegelnullpunkt (m +NHN) | 31.85 |
| Rechtswert (UTM 33 N) | 389447.20 |
| Hochwert (UTM 33 N) | 5822141.23 |
Für diese Station sind keine Hauptwerte vorhanden
Als Favorit speichern Als Favorit entfernen
Durch die Liste der Wasserstand-Messstellen blättern: