 DGS
DGS Leichte Sprache


MPS Berlin-Spandauer-Schifffahrtskanal
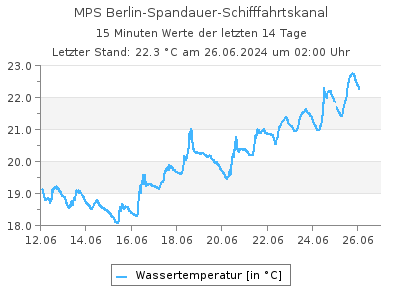
Aktuelle Wassertemperaturen als Tabelle
Letzter Tagesmittelwert (03.06.2024): 21,2 °CWassertemperaturen in °C im Intervall von 2 Stunden (in MEZ), Quelle: Land Berlin
| 00:00 | 02:00 | 04:00 | 06:00 | 08:00 | 10:00 | 12:00 | 14:00 | 16:00 | 18:00 | 20:00 | 22:00 | |
|---|---|---|---|---|---|---|---|---|---|---|---|---|
| 02.07.2024 | 22,9 | 22,5 | 22,1 | 22,0 | 21,9 | - | - | - | - | - | - | - |
| 01.07.2024 | 23,8 | 23,7 | 23,6 | 23,5 | 23,4 | 23,4 | 23,3 | 23,5 | 23,4 | 23,4 | 23,3 | 23,0 |
| 30.06.2024 | 23,9 | 23,8 | 23,7 | 23,7 | 23,7 | 24,0 | 24,0 | 24,1 | 24,0 | 24,0 | 24,0 | 23,9 |
| 29.06.2024 | 23,4 | 23,3 | 23,2 | 23,2 | 23,3 | 23,6 | 23,8 | 24,2 | 24,3 | 24,2 | 24,0 | 23,9 |
| 28.06.2024 | 23,7 | 23,4 | 23,3 | 23,2 | 23,4 | 23,8 | 23,7 | 24,0 | 23,9 | 23,7 | 23,6 | 23,5 |
| 27.06.2024 | 23,4 | 23,3 | 23,2 | 23,2 | 23,2 | 23,2 | 23,5 | 23,6 | 23,9 | 24,0 | 23,9 | 23,8 |
| 26.06.2024 | 22,4 | 22,3 | 22,1 | 22,1 | 22,2 | 22,4 | 22,9 | 23,2 | 23,8 | 23,7 | 23,6 | 23,5 |
| 25.06.2024 | 21,9 | 21,7 | 21,6 | 21,5 | 21,5 | 21,7 | 22,0 | 22,4 | 22,7 | 22,7 | 22,7 | 22,5 |
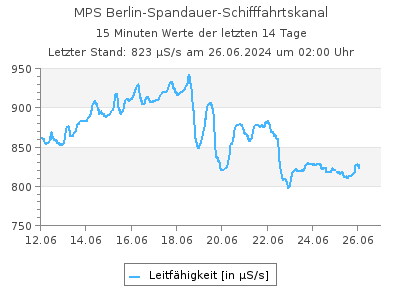
Aktuelle Leitfähigkeit als Tabelle
Letzter Tagesmittelwert (03.06.2024): 809 µS/sLeitfähigkeit in µS/s im Intervall von 2 Stunden (in MEZ), Quelle: Land Berlin
| 00:00 | 02:00 | 04:00 | 06:00 | 08:00 | 10:00 | 12:00 | 14:00 | 16:00 | 18:00 | 20:00 | 22:00 | |
|---|---|---|---|---|---|---|---|---|---|---|---|---|
| 02.07.2024 | 800 | 791 | 781 | 746 | 745 | - | - | - | - | - | - | - |
| 01.07.2024 | 797 | 804 | 809 | 805 | 800 | 801 | 805 | 801 | 799 | 797 | 800 | 804 |
| 30.06.2024 | 840 | 840 | 835 | 828 | 820 | 819 | 823 | 827 | 820 | 800 | 791 | 791 |
| 29.06.2024 | 808 | 817 | 835 | 859 | 841 | 786 | 783 | 801 | 818 | 824 | 835 | 839 |
| 28.06.2024 | 862 | 808 | 738 | 698 | 663 | 680 | 700 | 721 | 726 | 759 | 772 | 796 |
| 27.06.2024 | 825 | 835 | 840 | 837 | 834 | 831 | 832 | 837 | 844 | 848 | 850 | 846 |
| 26.06.2024 | 828 | 823 | 822 | 823 | 826 | 828 | 825 | 808 | 812 | 816 | 816 | 819 |
| 25.06.2024 | 820 | 818 | 817 | 815 | 816 | 812 | 812 | 811 | 812 | 814 | 816 | 826 |
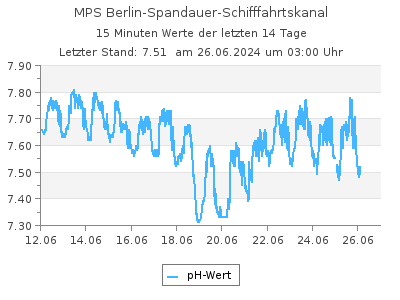
Aktuelle pH-Werte als Tabelle
Letzter Tagesmittelwert (03.06.2024): 7,50pH-Werte im Intervall von 2 Stunden (in MEZ), Quelle: Land Berlin
| 00:00 | 02:00 | 04:00 | 06:00 | 08:00 | 10:00 | 12:00 | 14:00 | 16:00 | 18:00 | 20:00 | 22:00 | |
|---|---|---|---|---|---|---|---|---|---|---|---|---|
| 02.07.2024 | 7,51 | 7,50 | 7,42 | 7,41 | 7,51 | - | - | - | - | - | - | - |
| 01.07.2024 | 7,50 | 7,48 | 7,47 | 7,48 | 7,70 | 7,67 | 7,64 | 7,70 | 7,75 | 7,63 | 7,68 | 7,52 |
| 30.06.2024 | 7,47 | 7,42 | 7,42 | 7,42 | 7,43 | 7,65 | 7,67 | 7,67 | 7,63 | 7,73 | 7,61 | 7,50 |
| 29.06.2024 | 7,36 | 7,31 | 7,36 | 7,39 | 7,49 | 7,43 | 7,47 | 7,46 | 7,51 | 7,57 | 7,59 | 7,41 |
| 28.06.2024 | 7,55 | 7,42 | 7,27 | 7,24 | 7,19 | 7,22 | 7,29 | 7,31 | 7,30 | 7,43 | 7,43 | 7,51 |
| 27.06.2024 | 7,65 | 7,62 | 7,61 | 7,67 | 7,64 | 7,75 | 7,80 | 7,80 | 7,77 | 7,75 | 7,67 | 7,67 |
| 26.06.2024 | 7,53 | 7,50 | 7,51 | 7,55 | 7,61 | 7,73 | 7,76 | 7,79 | 7,74 | 7,83 | 7,82 | 7,82 |
| 25.06.2024 | 7,55 | 7,52 | 7,50 | 7,51 | 7,60 | 7,66 | 7,68 | 7,68 | 7,72 | 7,77 | 7,59 | 7,65 |
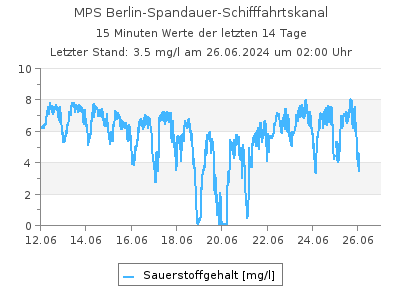
Aktuelle Sauerstoffgehalt-Werte als Tabelle
Letzter Tagesmittelwert (03.06.2024): 5,33 mg/lSauerstoffgehalt-Werte in mg/l im Intervall von 2 Stunden (in MEZ), Quelle: Land Berlin
| 00:00 | 02:00 | 04:00 | 06:00 | 08:00 | 10:00 | 12:00 | 14:00 | 16:00 | 18:00 | 20:00 | 22:00 | |
|---|---|---|---|---|---|---|---|---|---|---|---|---|
| 02.07.2024 | 2,13 | 2,48 | 0,910 | 1,16 | 4,69 | - | - | - | - | - | - | - |
| 01.07.2024 | 3,36 | 2,34 | 2,41 | 2,63 | 6,07 | 5,83 | 5,42 | 6,04 | 6,58 | 5,01 | 5,60 | 3,24 |
| 30.06.2024 | 4,25 | 2,27 | 0,650 | 2,18 | 3,96 | 6,11 | 6,27 | 6,04 | 5,56 | 6,72 | 5,43 | 2,74 |
| 29.06.2024 | 2,68 | 0,880 | 2,80 | 2,15 | 4,26 | 3,72 | 4,42 | 4,43 | 4,96 | 5,69 | 5,95 | 2,03 |
| 28.06.2024 | 5,02 | 3,28 | 0,690 | 0,040 | 0,420 | 1,24 | 2,53 | 2,65 | 2,20 | 4,25 | 4,05 | 5,24 |
| 27.06.2024 | 5,79 | 4,85 | 4,64 | 6,46 | 6,02 | 7,24 | 7,58 | 7,80 | 7,54 | 7,32 | 7,01 | 6,50 |
| 26.06.2024 | 4,23 | 3,46 | 3,06 | 5,57 | 6,27 | 7,30 | 7,56 | 7,50 | 6,94 | 7,68 | 7,73 | 7,75 |
| 25.06.2024 | 4,42 | 4,43 | 4,38 | 5,96 | 6,18 | 6,94 | 7,16 | 7,14 | 7,47 | 7,92 | 6,15 | 6,71 |
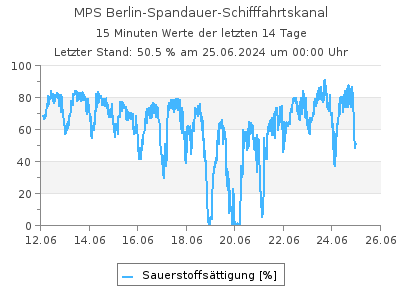
Aktuelle Werte Sauerstoffsättigung als Tabelle
Letzter Tagesmittelwert (29.06.2024): 43,0 %Werte Sauerstoffsättigung in % im Intervall von 2 Stunden (in MEZ), Quelle: Land Berlin
| 00:00 | 02:00 | 04:00 | 06:00 | 08:00 | 10:00 | 12:00 | 14:00 | 16:00 | 18:00 | 20:00 | 22:00 | |
|---|---|---|---|---|---|---|---|---|---|---|---|---|
| 02.07.2024 | 24,8 | - | - | - | - | - | - | - | - | - | - | - |
| 01.07.2024 | 39,8 | 27,7 | 28,4 | 31,0 | 71,4 | 68,5 | 63,6 | 71,2 | 77,4 | 58,9 | 65,7 | 37,8 |
| 30.06.2024 | 50,5 | 26,9 | 7,69 | 25,8 | 46,9 | 72,7 | 74,6 | 71,9 | 66,1 | 79,9 | 64,6 | 32,5 |
| 29.06.2024 | 31,5 | 10,3 | 32,8 | 25,2 | 50,0 | 43,9 | 52,4 | 52,9 | 59,3 | 67,9 | 70,8 | 24,1 |
| 28.06.2024 | 59,3 | 38,6 | 8,09 | 0,470 | 4,94 | 14,7 | 29,9 | 31,5 | 26,1 | 50,3 | 47,8 | 61,7 |
| 27.06.2024 | 68,1 | 57,0 | 54,4 | 75,7 | 70,5 | 84,8 | 89,3 | 92,0 | 89,4 | 87,0 | 83,2 | 77,0 |
| 26.06.2024 | 48,8 | 39,8 | 35,1 | 63,9 | 72,1 | 84,3 | 88,1 | 87,9 | 82,2 | 90,9 | 91,3 | 91,3 |
| 25.06.2024 | 50,5 | 50,4 | 49,7 | 67,5 | 70,0 | 79,1 | 82,0 | 82,4 | 86,7 | 92,0 | 71,4 | 77,6 |
| Messstellennummer | 601 |
|---|---|
| Messstellenname | MPS Berlin-Spandauer-Schifffahrtskanal |
| Gewässer | Berlin-Spandauer-Schifffahrtskanal |
| Betreiber | Land Berlin |
| Messstellenausprägung | Online-Messstelle |
| Flusskilometer | 9.08 |
| Rechtswert (UTM 33 N) | 387757.83 |
| Hochwert (UTM 33 N) | 5822226.26 |
Als Favorit speichern Als Favorit entfernen
Durch die Liste der Wassertemperatur-Messstellen blättern: