 DGS
DGS Leichte Sprache
MPS Neuk÷llner Schifffahrtskanal
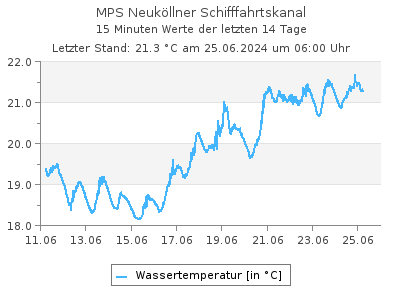
Aktuelle Wassertemperaturen als Tabelle
Letzter Tagesmittelwert (29.10.2025): 9,46 ░CWassertemperaturen in ░C im Intervall von 2 Stunden (in MEZ), Quelle: Land Berlin
| 00:00 | 02:00 | 04:00 | 06:00 | 08:00 | 10:00 | 12:00 | 14:00 | 16:00 | 18:00 | 20:00 | 22:00 | |
|---|---|---|---|---|---|---|---|---|---|---|---|---|
| 19.04.2026 | 14,1 | 14,0 | 13,9 | 13,7 | 13,7 | - | - | - | - | - | - | - |
| 18.04.2026 | 12,7 | 12,5 | 12,4 | 12,2 | 12,3 | 12,5 | 12,9 | 13,5 | 14,1 | 14,1 | 14,0 | 14,1 |
| 17.04.2026 | 11,9 | 11,9 | 11,8 | 11,7 | 11,8 | 12,1 | 12,8 | 13,4 | 13,5 | 13,2 | 13,1 | 12,9 |
| 16.04.2026 | 11,5 | 11,3 | 11,1 | 11,0 | 11,1 | 11,1 | 11,4 | 12,1 | 12,2 | 12,1 | 12,0 | 12,0 |
| 15.04.2026 | 10,1 | 10,0 | 9,93 | 9,84 | 9,86 | 10,2 | 10,5 | 11,1 | 11,4 | 11,6 | 11,5 | 11,5 |
| 14.04.2026 | 10,0 | 9,99 | 10,1 | 9,95 | 9,99 | 10,0 | 10,2 | 10,4 | 10,6 | 10,5 | 10,4 | 10,3 |
| 13.04.2026 | 9,97 | 9,76 | 9,62 | 9,57 | 9,46 | 9,48 | 9,67 | 9,94 | 10,1 | 10,1 | 10,1 | 10,1 |
| 12.04.2026 | 10,4 | 10,3 | 10,2 | 10,1 | 10,0 | 9,99 | 10,1 | 10,1 | 10,1 | 10,1 | 10,0 | 10,0 |
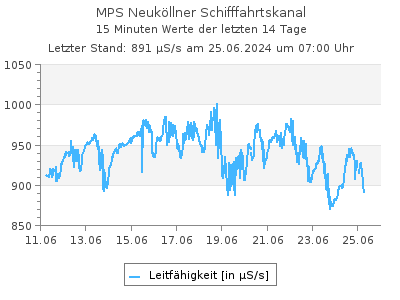
Aktuelle Leitfõhigkeit als Tabelle
Letzter Tagesmittelwert (29.10.2025): 1.101 ĄS/sLeitfõhigkeit in ĄS/s im Intervall von 2 Stunden (in MEZ), Quelle: Land Berlin
| 00:00 | 02:00 | 04:00 | 06:00 | 08:00 | 10:00 | 12:00 | 14:00 | 16:00 | 18:00 | 20:00 | 22:00 | |
|---|---|---|---|---|---|---|---|---|---|---|---|---|
| 19.04.2026 | 1.062 | 1.052 | 1.028 | 977 | 969 | - | - | - | - | - | - | - |
| 18.04.2026 | 931 | 928 | 931 | 931 | 938 | 949 | 971 | 1.009 | 1.046 | 1.063 | 1.052 | 1.056 |
| 17.04.2026 | 963 | 940 | 947 | 956 | 984 | 975 | 973 | 938 | 919 | 925 | 951 | 947 |
| 16.04.2026 | 1.013 | 985 | 947 | 936 | 939 | 931 | 951 | 924 | 1.005 | 1.034 | 1.027 | 1.037 |
| 15.04.2026 | 943 | 931 | 929 | 931 | 929 | 1.059 | 1.024 | 1.044 | 1.046 | 1.022 | 1.044 | 1.049 |
| 14.04.2026 | 1.086 | 1.089 | 1.097 | 1.108 | 1.136 | 1.134 | 1.120 | 1.044 | 1.018 | 1.018 | 1.003 | 955 |
| 13.04.2026 | 1.098 | 963 | 925 | 901 | 879 | 869 | 910 | 1.011 | 1.037 | 1.047 | 1.067 | 1.079 |
| 12.04.2026 | 1.109 | 1.112 | 1.118 | 1.122 | 1.119 | 1.122 | 1.123 | 1.132 | 1.125 | 1.124 | 1.107 | 1.108 |
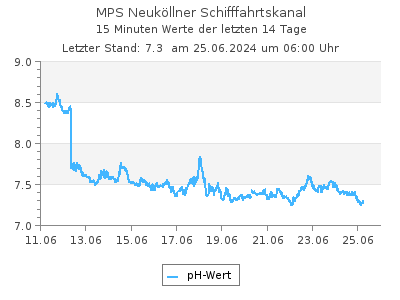
Aktuelle pH-Werte als Tabelle
Letzter Tagesmittelwert (29.10.2025): 7,78pH-Werte im Intervall von 2 Stunden (in MEZ), Quelle: Land Berlin
| 00:00 | 02:00 | 04:00 | 06:00 | 08:00 | 10:00 | 12:00 | 14:00 | 16:00 | 18:00 | 20:00 | 22:00 | |
|---|---|---|---|---|---|---|---|---|---|---|---|---|
| 19.04.2026 | 7,83 | 7,84 | 7,80 | 7,87 | 7,81 | - | - | - | - | - | - | - |
| 18.04.2026 | 7,70 | 7,66 | 7,63 | 7,64 | 7,64 | 7,77 | 7,93 | 7,96 | 8,04 | 8,05 | 7,95 | 7,85 |
| 17.04.2026 | 7,80 | 7,78 | 7,69 | 7,70 | 7,78 | 7,79 | 7,88 | 7,92 | 7,85 | 7,91 | 7,84 | 7,78 |
| 16.04.2026 | 7,92 | 7,90 | 7,91 | 7,83 | 7,74 | 7,71 | 7,80 | 7,96 | 7,94 | 7,94 | 7,89 | 7,80 |
| 15.04.2026 | 7,78 | 7,76 | 7,71 | 7,66 | 7,65 | 7,76 | 7,83 | 7,87 | 7,86 | 7,85 | 7,84 | 7,86 |
| 14.04.2026 | 7,83 | 7,74 | 7,77 | 7,67 | 7,69 | 7,70 | 7,71 | 7,83 | 7,86 | 7,80 | 7,85 | 7,82 |
| 13.04.2026 | 7,60 | 7,68 | 7,73 | 7,69 | 7,67 | 7,68 | 7,83 | 7,91 | 7,91 | 7,76 | 7,90 | 7,89 |
| 12.04.2026 | 7,73 | 7,69 | 7,66 | 7,63 | 7,64 | 7,62 | 7,72 | 7,71 | 7,74 | 7,73 | 7,68 | 7,64 |
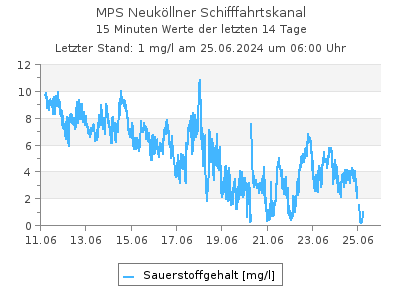
Aktuelle Sauerstoffgehalt-Werte als Tabelle
Letzter Tagesmittelwert (29.10.2025): 3,76 mg/lSauerstoffgehalt-Werte in mg/l im Intervall von 2 Stunden (in MEZ), Quelle: Land Berlin
| 00:00 | 02:00 | 04:00 | 06:00 | 08:00 | 10:00 | 12:00 | 14:00 | 16:00 | 18:00 | 20:00 | 22:00 | |
|---|---|---|---|---|---|---|---|---|---|---|---|---|
| 19.04.2026 | 10,8 | 10,7 | 10,9 | 12,2 | 11,0 | - | - | - | - | - | - | - |
| 18.04.2026 | 10,3 | 9,03 | 8,78 | 8,39 | 9,63 | 10,7 | 13,4 | 13,8 | 14,6 | 14,6 | 12,7 | 11,6 |
| 17.04.2026 | 12,3 | 11,7 | 10,4 | 10,1 | 12,7 | 11,9 | 13,4 | 12,8 | 12,2 | 12,7 | 11,4 | 10,4 |
| 16.04.2026 | 14,4 | 13,6 | 13,2 | 12,3 | 11,2 | 10,8 | 13,0 | 14,0 | 14,9 | 15,2 | 14,0 | 12,5 |
| 15.04.2026 | 12,9 | 12,4 | 11,8 | 11,3 | 10,7 | 13,9 | 13,8 | 14,3 | 14,5 | 13,8 | 14,4 | 14,7 |
| 14.04.2026 | 14,9 | 14,3 | 14,3 | 13,9 | 13,9 | 13,4 | 13,4 | 14,0 | 14,0 | 14,0 | 14,1 | 13,5 |
| 13.04.2026 | 12,6 | 12,0 | 11,9 | 11,5 | 11,2 | 11,0 | 12,0 | 13,1 | 14,3 | 14,3 | 15,0 | 15,2 |
| 12.04.2026 | 14,1 | 13,9 | 13,7 | 13,0 | 13,4 | 13,1 | 14,0 | 14,1 | 14,0 | 14,0 | 13,6 | 13,1 |
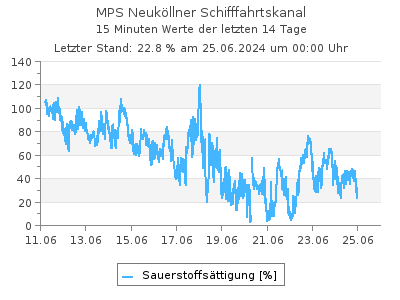
Aktuelle Werte Sauerstoffsõttigung als Tabelle
Letzter Tagesmittelwert (18.04.2026): 111 %Werte Sauerstoffsõttigung in % im Intervall von 2 Stunden (in MEZ), Quelle: Land Berlin
| 00:00 | 02:00 | 04:00 | 06:00 | 08:00 | 10:00 | 12:00 | 14:00 | 16:00 | 18:00 | 20:00 | 22:00 | |
|---|---|---|---|---|---|---|---|---|---|---|---|---|
| 19.04.2026 | 105 | - | - | - | - | - | - | - | - | - | - | - |
| 18.04.2026 | 97,2 | 85,1 | 82,4 | 78,4 | 90,2 | 101 | 127 | 133 | 142 | 142 | 124 | 113 |
| 17.04.2026 | 114 | 109 | 96,3 | 93,2 | 118 | 111 | 127 | 123 | 117 | 121 | 109 | 98,3 |
| 16.04.2026 | 133 | 125 | 121 | 112 | 102 | 98,8 | 120 | 131 | 140 | 142 | 131 | 117 |
| 15.04.2026 | 115 | 110 | 105 | 100 | 94,9 | 124 | 124 | 130 | 133 | 127 | 133 | 135 |
| 14.04.2026 | 133 | 127 | 127 | 124 | 123 | 120 | 119 | 126 | 126 | 126 | 126 | 120 |
| 13.04.2026 | 112 | 106 | 105 | 102 | 98,2 | 96,1 | 105 | 116 | 127 | 128 | 134 | 135 |
| 12.04.2026 | 126 | 124 | 123 | 116 | 119 | 116 | 124 | 126 | 125 | 125 | 121 | 117 |
| Messstellennummer | 504 |
|---|---|
| Messstellenname | MPS Neuk÷llner Schifffahrtskanal |
| Gewõsser | Neuk÷llner Schifffahrtskanal |
| Betreiber | Land Berlin |
| Messstellenausprõgung | Online-Messstelle |
| Flusskilometer | 0.73 |
| Rechtswert (UTM 33 N) | 394374.64 |
| Hochwert (UTM 33 N) | 5816093.86 |
Als Favorit speichern Als Favorit entfernen
Durch die Liste der Durchfluss-Messstellen blõttern: