 DGS
DGS Leichte Sprache
Eisstadion
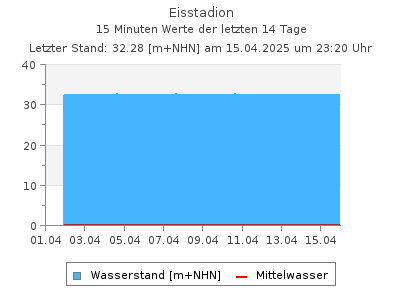
Aktuelle Wasserstände als Tabelle
Letzter Tagesmittelwert (02.07.2026): 45,1 cmWasserstände W in cm im Intervall von 2 Stunden (in MEZ), Quelle: Land Berlin
| 00:00 | 02:00 | 04:00 | 06:00 | 08:00 | 10:00 | 12:00 | 14:00 | 16:00 | 18:00 | 20:00 | 22:00 | |
|---|---|---|---|---|---|---|---|---|---|---|---|---|
| 03.07.2026 | 45,3 | 45,3 | 45,3 | - | - | - | - | - | - | - | - | - |
| 02.07.2026 | - | 45,1 | 21,6 | 33,1 | 45,8 | 45,5 | 45,4 | 45,3 | 45,2 | 44,9 | 44,9 | 45,0 |
| 01.07.2026 | 45,1 | 45,3 | 20,4 | 34,6 | 41,4 | 41,8 | 41,2 | 41,5 | 45,9 | 44,9 | 45,0 | 45,0 |
| 30.06.2026 | 44,9 | 45,0 | 19,5 | 35,1 | 41,4 | 41,0 | 41,4 | 41,3 | 45,9 | 45,0 | 44,9 | 45,0 |
| 29.06.2026 | 44,4 | 44,5 | 44,7 | 44,8 | 44,9 | 44,9 | 44,8 | 32,2 | 45,3 | 44,5 | 44,5 | 44,6 |
| 28.06.2026 | 44,2 | 44,3 | 44,5 | 44,6 | 44,5 | 44,6 | 44,6 | 44,5 | 44,3 | 44,1 | 44,0 | 44,1 |
| 27.06.2026 | 43,4 | 43,6 | 43,8 | 43,9 | 44,1 | 43,9 | 43,9 | 43,8 | 43,6 | 43,6 | 43,6 | 43,9 |
| 26.06.2026 | 41,2 | 41,7 | 15,4 | 35,0 | 39,2 | 39,9 | 39,9 | 39,9 | 43,5 | 43,0 | 43,1 | 43,2 |
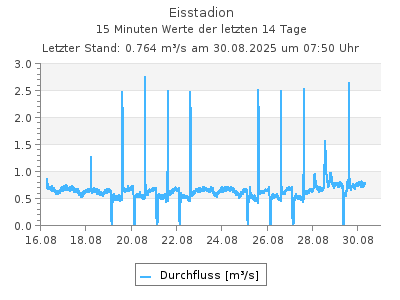
Aktuelle Abflüsse als Tabelle
Letzter Tagesmittelwert (02.07.2026): 0,530 m3/sAbflüsse Q in mł/s im Intervall von 2 Stunden (in MEZ), Quelle: Land Berlin
| 00:00 | 02:00 | 04:00 | 06:00 | 08:00 | 10:00 | 12:00 | 14:00 | 16:00 | 18:00 | 20:00 | 22:00 | |
|---|---|---|---|---|---|---|---|---|---|---|---|---|
| 03.07.2026 | 0,496 | 0,497 | 0,474 | - | - | - | - | - | - | - | - | - |
| 02.07.2026 | - | 0,564 | 0,109 | 0,315 | 0,544 | 0,550 | 0,557 | 0,500 | 0,518 | 0,536 | 0,476 | 0,542 |
| 01.07.2026 | 0,517 | 0,541 | 0,076 | 0,333 | 0,330 | 0,398 | 0,340 | 0,359 | 0,587 | 0,493 | 0,542 | 0,532 |
| 30.06.2026 | 0,518 | 0,555 | 0,026 | 0,302 | 0,341 | 0,325 | 0,320 | 0,318 | 0,596 | 0,564 | 0,582 | 0,534 |
| 29.06.2026 | 0,532 | 0,531 | 0,560 | 0,555 | 0,547 | 0,515 | 0,551 | 0,130 | 0,520 | 0,505 | 0,455 | 0,525 |
| 28.06.2026 | 0,566 | 0,535 | 0,562 | 0,562 | 0,548 | 0,560 | 0,543 | 0,524 | 0,519 | 0,479 | 0,559 | 0,525 |
| 27.06.2026 | 0,557 | 0,541 | 0,543 | 0,586 | 0,553 | 0,562 | 0,543 | 0,521 | 0,548 | 0,524 | 0,562 | 0,557 |
| 26.06.2026 | 0,592 | 0,571 | 0,029 | 0,350 | 0,408 | 0,417 | 0,435 | 0,431 | 0,609 | 0,546 | 0,538 | 0,554 |
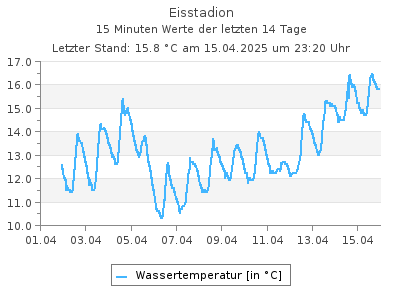
Aktuelle Wassertemperaturen als Tabelle
Letzter Tagesmittelwert (02.07.2026): 21,2 °CWassertemperaturen in °C im Intervall von 2 Stunden (in MEZ), Quelle: Land Berlin
| 00:00 | 02:00 | 04:00 | 06:00 | 08:00 | 10:00 | 12:00 | 14:00 | 16:00 | 18:00 | 20:00 | 22:00 | |
|---|---|---|---|---|---|---|---|---|---|---|---|---|
| 03.07.2026 | 21,0 | 20,5 | 19,8 | - | - | - | - | - | - | - | - | - |
| 02.07.2026 | 21,2 | 20,7 | 20,2 | 20,1 | 20,0 | 20,5 | 21,7 | 22,7 | 22,7 | 22,1 | 21,6 | 21,3 |
| 01.07.2026 | 22,5 | 22,3 | 21,8 | 21,8 | 21,6 | 21,6 | 21,8 | 22,2 | 22,5 | 22,3 | 21,9 | 21,6 |
| 30.06.2026 | 22,4 | 22,0 | 21,5 | 21,4 | 21,2 | 21,4 | 22,1 | 22,9 | 23,8 | 23,3 | 22,9 | 22,6 |
| 29.06.2026 | 24,6 | 24,2 | 23,7 | 23,4 | 23,4 | 23,5 | 23,4 | 24,0 | 24,0 | 23,6 | 23,1 | 22,7 |
| 28.06.2026 | 24,2 | 23,9 | 23,5 | 23,3 | 23,4 | 23,9 | 24,8 | 26,1 | 26,5 | 25,8 | 25,3 | 24,9 |
| 27.06.2026 | 22,9 | 22,5 | 22,1 | 21,8 | 21,9 | 22,5 | 23,8 | 25,1 | 25,8 | 25,0 | 24,6 | 24,4 |
| 26.06.2026 | 23,0 | 22,4 | 21,7 | 21,7 | 21,4 | 21,6 | 22,5 | 23,5 | 24,6 | 24,0 | 23,4 | 23,1 |
| Messstellennummer | 5867601 |
|---|---|
| Messstellenname | Eisstadion |
| Gewässer | Panke |
| Betreiber | Land Berlin |
| Messstellenausprägung | Wasserstand und Durchfluss |
| Flusskilometer | |
| Pegelnullpunkt (m +NHN) | 31.85 |
| Rechtswert (UTM 33 N) | 389447.20 |
| Hochwert (UTM 33 N) | 5822141.23 |
Für diese Station sind keine Hauptwerte vorhanden
Als Favorit speichern Als Favorit entfernen
Durch die Liste der Wasserstand-Messstellen blättern: