 DGS
DGS Leichte Sprache
MPS Caprivibr³cke
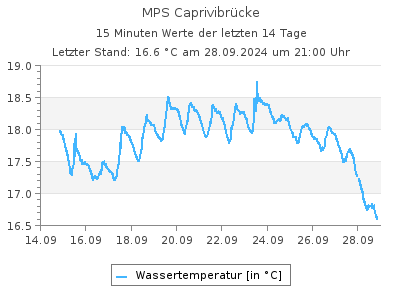
Aktuelle Wassertemperaturen als Tabelle
Letzter Tagesmittelwert (27.10.2025): 10,3 ░CWassertemperaturen in ░C im Intervall von 2 Stunden (in MEZ), Quelle: Land Berlin
| 00:00 | 02:00 | 04:00 | 06:00 | 08:00 | 10:00 | 12:00 | 14:00 | 16:00 | 18:00 | 20:00 | 22:00 | |
|---|---|---|---|---|---|---|---|---|---|---|---|---|
| 01.05.2026 | 14,1 | 14,0 | 14,0 | - | - | - | - | - | - | - | - | - |
| 30.04.2026 | 13,7 | 13,6 | 13,5 | 13,4 | 13,5 | 13,6 | 14,3 | 14,4 | 14,4 | 14,5 | 14,4 | 14,3 |
| 29.04.2026 | 13,4 | 13,3 | 13,3 | 13,2 | 13,2 | 13,3 | 13,5 | 13,7 | 14,1 | 14,1 | 14,0 | 13,9 |
| 28.04.2026 | 13,3 | 13,3 | 13,2 | 13,0 | 13,0 | 13,0 | 13,4 | 13,6 | 13,8 | 13,8 | 13,8 | 13,6 |
| 27.04.2026 | 13,2 | 13,1 | 13,0 | 12,8 | 12,8 | 12,9 | 13,2 | 13,5 | 13,6 | 13,7 | 13,6 | 13,4 |
| 26.04.2026 | 13,0 | 12,9 | 12,7 | 12,6 | 12,5 | 12,6 | 12,9 | 13,2 | 13,5 | 13,5 | 13,5 | 13,3 |
| 25.04.2026 | 12,9 | 12,7 | 12,6 | 12,6 | 12,5 | 12,5 | 12,8 | 13,2 | 13,4 | 13,5 | 13,3 | 13,1 |
| 24.04.2026 | 12,9 | 12,7 | 12,6 | 12,5 | 12,5 | 12,5 | 12,6 | 12,9 | 13,1 | 13,2 | 13,1 | 13,0 |
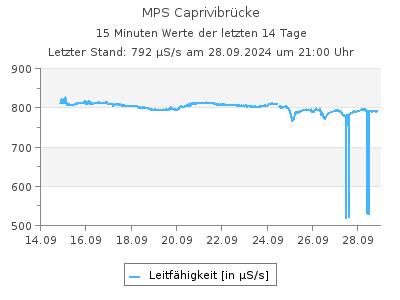
Aktuelle Leitfõhigkeit als Tabelle
Letzter Tagesmittelwert (27.10.2025): 822 ĄS/sLeitfõhigkeit in ĄS/s im Intervall von 2 Stunden (in MEZ), Quelle: Land Berlin
| 00:00 | 02:00 | 04:00 | 06:00 | 08:00 | 10:00 | 12:00 | 14:00 | 16:00 | 18:00 | 20:00 | 22:00 | |
|---|---|---|---|---|---|---|---|---|---|---|---|---|
| 01.05.2026 | 846 | 849 | 844 | - | - | - | - | - | - | - | - | - |
| 30.04.2026 | 841 | 845 | 842 | 843 | 845 | 846 | 840 | 842 | 844 | 841 | 842 | 843 |
| 29.04.2026 | 837 | 835 | 835 | 833 | 835 | 833 | 835 | 837 | 835 | 837 | 839 | 839 |
| 28.04.2026 | 828 | 828 | 828 | 828 | 834 | 828 | 830 | 831 | 832 | 834 | 834 | 836 |
| 27.04.2026 | 818 | 818 | 822 | 824 | 821 | 821 | 822 | 821 | 826 | 828 | 825 | 829 |
| 26.04.2026 | 816 | 819 | 822 | 819 | 818 | 820 | 820 | 815 | 821 | 821 | 819 | 818 |
| 25.04.2026 | 816 | 820 | 818 | 819 | 820 | 815 | 826 | 821 | 818 | 822 | 822 | 816 |
| 24.04.2026 | 823 | 823 | 826 | 824 | 822 | 822 | 823 | 821 | 823 | 818 | 824 | 819 |
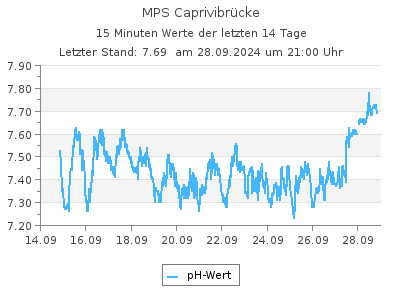
Aktuelle pH-Werte als Tabelle
Letzter Tagesmittelwert (27.10.2025): 7,22pH-Werte im Intervall von 2 Stunden (in MEZ), Quelle: Land Berlin
| 00:00 | 02:00 | 04:00 | 06:00 | 08:00 | 10:00 | 12:00 | 14:00 | 16:00 | 18:00 | 20:00 | 22:00 | |
|---|---|---|---|---|---|---|---|---|---|---|---|---|
| 01.05.2026 | 7,43 | 7,43 | 7,46 | - | - | - | - | - | - | - | - | - |
| 30.04.2026 | 7,46 | 7,46 | 7,49 | 7,50 | 7,50 | 7,50 | 7,55 | 7,55 | 7,51 | 7,52 | 7,50 | 7,45 |
| 29.04.2026 | 7,46 | 7,48 | 7,48 | 7,50 | 7,52 | 7,55 | 7,54 | 7,52 | 7,54 | 7,54 | 7,51 | 7,48 |
| 28.04.2026 | 7,53 | 7,53 | 7,53 | 7,52 | 7,50 | 7,54 | 7,53 | 7,53 | 7,51 | 7,48 | 7,48 | 7,46 |
| 27.04.2026 | 7,51 | 7,49 | 7,49 | 7,52 | 7,56 | 7,59 | 7,59 | 7,60 | 7,56 | 7,52 | 7,54 | 7,48 |
| 26.04.2026 | 7,54 | 7,52 | 7,48 | 7,54 | 7,58 | 7,57 | 7,57 | 7,61 | 7,57 | 7,55 | 7,57 | 7,53 |
| 25.04.2026 | 7,52 | 7,51 | 7,54 | 7,55 | 7,56 | 7,60 | 7,54 | 7,56 | 7,59 | 7,55 | 7,54 | 7,55 |
| 24.04.2026 | 7,51 | 7,49 | 7,49 | 7,52 | 7,55 | 7,55 | 7,56 | 7,56 | 7,55 | 7,57 | 7,53 | 7,52 |
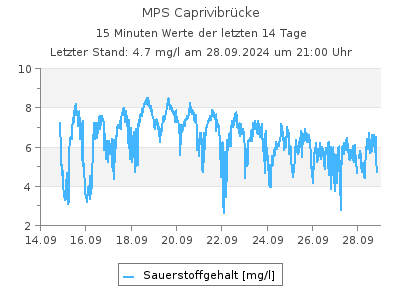
Aktuelle Sauerstoffgehalt-Werte als Tabelle
Letzter Tagesmittelwert (27.10.2025): 7,80 mg/lSauerstoffgehalt-Werte in mg/l im Intervall von 2 Stunden (in MEZ), Quelle: Land Berlin
| 00:00 | 02:00 | 04:00 | 06:00 | 08:00 | 10:00 | 12:00 | 14:00 | 16:00 | 18:00 | 20:00 | 22:00 | |
|---|---|---|---|---|---|---|---|---|---|---|---|---|
| 01.05.2026 | 7,73 | 7,49 | 7,91 | - | - | - | - | - | - | - | - | - |
| 30.04.2026 | 8,07 | 8,16 | 8,35 | 8,31 | 8,26 | 8,39 | 8,72 | 8,80 | 8,62 | 8,54 | 8,46 | 7,58 |
| 29.04.2026 | 7,81 | 8,01 | 7,79 | 8,25 | 8,42 | 8,65 | 8,68 | 8,62 | 8,73 | 8,79 | 8,55 | 8,07 |
| 28.04.2026 | 7,92 | 7,64 | 7,37 | 7,45 | 7,77 | 8,29 | 8,49 | 8,58 | 8,45 | 8,29 | 8,02 | 7,97 |
| 27.04.2026 | 7,38 | 6,65 | 6,44 | 7,25 | 8,23 | 8,66 | 8,71 | 8,75 | 8,50 | 7,93 | 8,03 | 7,27 |
| 26.04.2026 | 7,54 | 6,94 | 6,33 | 7,27 | 8,32 | 8,27 | 8,52 | 8,76 | 8,45 | 8,34 | 8,49 | 7,42 |
| 25.04.2026 | 7,63 | 6,98 | 7,09 | 8,10 | 8,29 | 8,58 | 8,08 | 8,35 | 8,55 | 8,36 | 8,17 | 7,98 |
| 24.04.2026 | 7,05 | 7,26 | 7,32 | 7,73 | 8,24 | 8,20 | 8,26 | 8,40 | 8,23 | 8,46 | 8,05 | 7,47 |
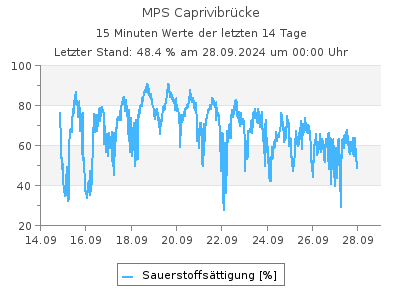
Aktuelle Werte Sauerstoffsõttigung als Tabelle
Letzter Tagesmittelwert (29.04.2026): 81,0 %Werte Sauerstoffsõttigung in % im Intervall von 2 Stunden (in MEZ), Quelle: Land Berlin
| 00:00 | 02:00 | 04:00 | 06:00 | 08:00 | 10:00 | 12:00 | 14:00 | 16:00 | 18:00 | 20:00 | 22:00 | |
|---|---|---|---|---|---|---|---|---|---|---|---|---|
| 01.05.2026 | - | - | - | - | - | - | - | - | - | - | - | - |
| 30.04.2026 | 78,0 | - | - | - | - | - | - | - | - | - | - | - |
| 29.04.2026 | 75,1 | 76,8 | 74,6 | 78,9 | 80,5 | 82,8 | 83,6 | 83,4 | 85,1 | 85,7 | 83,2 | 78,3 |
| 28.04.2026 | 75,9 | 73,1 | 70,4 | 71,0 | 74,0 | 79,0 | 81,5 | 82,7 | 81,9 | 80,4 | 77,6 | 76,9 |
| 27.04.2026 | 70,5 | 63,4 | 61,3 | 68,8 | 78,0 | 82,3 | 83,3 | 84,1 | 82,0 | 76,6 | 77,4 | 69,9 |
| 26.04.2026 | 71,7 | 65,9 | 59,9 | 68,6 | 78,4 | 78,0 | 81,0 | 83,7 | 81,2 | 80,3 | 81,6 | 71,1 |
| 25.04.2026 | 72,4 | 66,1 | 67,0 | 76,3 | 78,0 | 80,8 | 76,6 | 79,8 | 82,0 | 80,4 | 78,3 | 76,2 |
| 24.04.2026 | 66,9 | 68,7 | 69,1 | 72,8 | 77,5 | 77,2 | 77,9 | 79,8 | 78,6 | 80,9 | 76,9 | 71,1 |
| Messstellennummer | 151 |
|---|---|
| Messstellenname | MPS Caprivibr³cke |
| Gewõsser | Spree |
| Betreiber | Land Berlin |
| Messstellenausprõgung | Online-Messstelle |
| Flusskilometer | 8.75 |
| Rechtswert (UTM 33 N) | 385516.70 |
| Hochwert (UTM 33 N) | 5820267.04 |
Als Favorit speichern Als Favorit entfernen
Durch die Liste der Durchfluss-Messstellen blõttern: