 DGS
DGS Leichte Sprache
MPS Berlin-Spandauer-Schifffahrtskanal
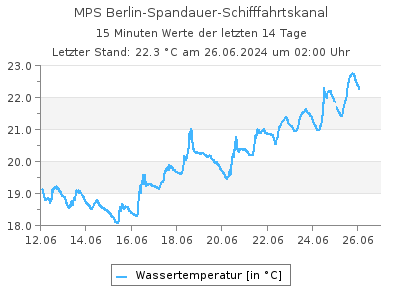
Aktuelle Wassertemperaturen als Tabelle
Letzter Tagesmittelwert (05.07.2026): 21,1 °CWassertemperaturen in °C im Intervall von 2 Stunden (in MEZ), Quelle: Land Berlin
| 00:00 | 02:00 | 04:00 | 06:00 | 08:00 | 10:00 | 12:00 | 14:00 | 16:00 | 18:00 | 20:00 | 22:00 | |
|---|---|---|---|---|---|---|---|---|---|---|---|---|
| 01.08.2026 | 23,0 | 22,9 | 22,8 | 22,8 | 22,5 | - | - | - | - | - | - | - |
| 31.07.2026 | 22,2 | 22,2 | 22,1 | 22,1 | 22,1 | 22,3 | 22,9 | 23,4 | 23,3 | 23,2 | 23,1 | 23,0 |
| 30.07.2026 | 21,2 | 21,1 | 21,1 | 21,0 | 21,4 | 21,7 | 22,1 | 23,1 | 23,1 | 22,8 | 22,4 | 22,3 |
| 29.07.2026 | 20,5 | 20,5 | 20,4 | 20,4 | 20,6 | 20,6 | 20,8 | 21,0 | 21,5 | 21,3 | 21,3 | 21,3 |
| 28.07.2026 | 20,2 | 20,2 | 20,2 | 20,1 | 20,2 | 20,3 | 20,3 | 20,5 | 20,6 | 20,6 | 20,6 | 20,5 |
| 27.07.2026 | 20,9 | 20,7 | 20,6 | 20,5 | 20,5 | 20,5 | 20,5 | 20,4 | 20,4 | 20,4 | 20,4 | 20,3 |
| 26.07.2026 | 20,8 | 20,7 | 20,6 | 20,6 | 20,6 | 20,8 | 21,0 | 21,1 | 21,0 | 21,0 | 21,0 | 21,0 |
| 25.07.2026 | 19,8 | 19,7 | 19,7 | 19,6 | 19,8 | 20,0 | 20,5 | 21,3 | 21,0 | 21,0 | 20,9 | 20,8 |
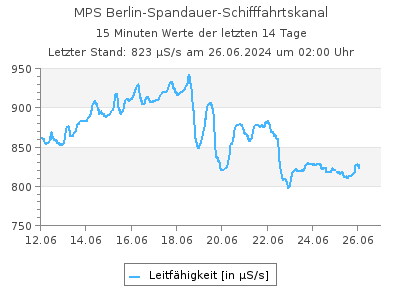
Aktuelle Leitfähigkeit als Tabelle
Letzter Tagesmittelwert (05.07.2026): 984 µS/sLeitfähigkeit in µS/s im Intervall von 2 Stunden (in MEZ), Quelle: Land Berlin
| 00:00 | 02:00 | 04:00 | 06:00 | 08:00 | 10:00 | 12:00 | 14:00 | 16:00 | 18:00 | 20:00 | 22:00 | |
|---|---|---|---|---|---|---|---|---|---|---|---|---|
| 01.08.2026 | 934 | 933 | 935 | 918 | 879 | - | - | - | - | - | - | - |
| 31.07.2026 | 918 | 920 | 917 | 919 | 920 | 922 | 924 | 925 | 925 | 927 | 929 | 930 |
| 30.07.2026 | 933 | 934 | 934 | 932 | 933 | 932 | 928 | 929 | 928 | 919 | 919 | 919 |
| 29.07.2026 | 909 | 908 | 912 | 920 | 927 | 929 | 929 | 930 | 932 | 932 | 933 | 933 |
| 28.07.2026 | 832 | 843 | 864 | 880 | 894 | 907 | 918 | 924 | 925 | 922 | 920 | 912 |
| 27.07.2026 | 993 | 978 | 972 | 958 | 966 | 966 | 893 | 845 | 826 | 818 | 821 | 824 |
| 26.07.2026 | 980 | 982 | 984 | 984 | 986 | 989 | 993 | 995 | 995 | 996 | 995 | 996 |
| 25.07.2026 | 907 | 908 | 907 | 912 | 917 | 928 | 941 | 951 | 951 | 969 | 973 | 979 |
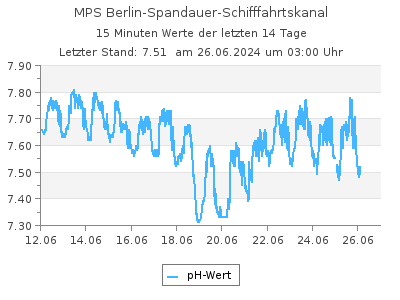
Aktuelle pH-Werte als Tabelle
Letzter Tagesmittelwert (05.07.2026): 7,97pH-Werte im Intervall von 2 Stunden (in MEZ), Quelle: Land Berlin
| 00:00 | 02:00 | 04:00 | 06:00 | 08:00 | 10:00 | 12:00 | 14:00 | 16:00 | 18:00 | 20:00 | 22:00 | |
|---|---|---|---|---|---|---|---|---|---|---|---|---|
| 01.08.2026 | 8,04 | 7,99 | 7,89 | 8,04 | 7,90 | - | - | - | - | - | - | - |
| 31.07.2026 | 7,96 | 7,89 | 7,96 | 7,89 | 8,05 | 8,10 | 8,19 | 8,24 | 8,30 | 8,33 | 8,20 | 8,14 |
| 30.07.2026 | 7,88 | 7,85 | 7,88 | 7,97 | 7,97 | 8,02 | 8,05 | 8,09 | 8,12 | 8,16 | 8,08 | 8,01 |
| 29.07.2026 | 7,79 | 7,76 | 7,77 | 7,83 | 7,88 | 7,94 | 7,95 | 7,96 | 7,99 | 7,99 | 7,98 | 7,88 |
| 28.07.2026 | 7,71 | 7,69 | 7,70 | 7,76 | 7,80 | 7,90 | 7,91 | 7,91 | 7,91 | 7,90 | 7,85 | 7,84 |
| 27.07.2026 | 7,81 | 7,85 | 7,84 | 7,87 | 7,89 | 7,93 | 7,84 | 7,79 | 7,76 | 7,75 | 7,75 | 7,70 |
| 26.07.2026 | 7,82 | 7,80 | 7,78 | 7,80 | 7,88 | 7,89 | 7,91 | 7,89 | 7,88 | 7,87 | 7,85 | 7,80 |
| 25.07.2026 | 7,83 | 7,75 | 7,74 | 7,86 | 7,79 | 7,89 | 7,91 | 7,89 | 7,91 | 7,90 | 7,92 | 7,90 |
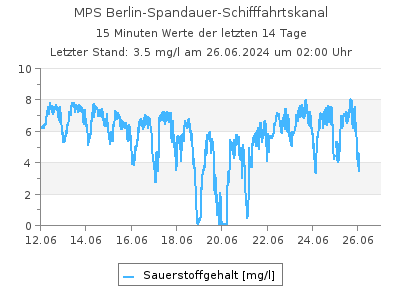
Aktuelle Sauerstoffgehalt-Werte als Tabelle
Letzter Tagesmittelwert (05.07.2026): 4,91 mg/lSauerstoffgehalt-Werte in mg/l im Intervall von 2 Stunden (in MEZ), Quelle: Land Berlin
| 00:00 | 02:00 | 04:00 | 06:00 | 08:00 | 10:00 | 12:00 | 14:00 | 16:00 | 18:00 | 20:00 | 22:00 | |
|---|---|---|---|---|---|---|---|---|---|---|---|---|
| 01.08.2026 | 9,03 | 7,74 | 6,01 | 8,97 | 5,78 | - | - | - | - | - | - | - |
| 31.07.2026 | 7,66 | 5,69 | 7,29 | 5,06 | 8,95 | 9,42 | 10,3 | 11,0 | 11,4 | 11,8 | 10,8 | 10,6 |
| 30.07.2026 | 6,43 | 5,45 | 6,22 | 7,69 | 7,59 | 8,18 | 8,77 | 9,11 | 9,45 | 9,92 | 9,21 | 8,22 |
| 29.07.2026 | 4,64 | 4,15 | 4,39 | 6,09 | 6,10 | 6,99 | 7,03 | 7,30 | 7,81 | 7,67 | 7,75 | 6,40 |
| 28.07.2026 | 3,68 | 1,90 | 2,96 | 4,47 | 5,31 | 6,20 | 6,33 | 6,18 | 6,37 | 6,28 | 5,44 | 5,59 |
| 27.07.2026 | 4,52 | 5,19 | 5,04 | 5,39 | 5,52 | 5,96 | 4,76 | 3,95 | 3,80 | 4,15 | 4,49 | 4,11 |
| 26.07.2026 | 3,91 | 3,03 | 1,60 | 1,21 | 5,84 | 5,98 | 6,17 | 6,05 | 5,86 | 5,69 | 5,32 | 4,49 |
| 25.07.2026 | 4,50 | 2,05 | 1,55 | 5,51 | 4,52 | 5,94 | 6,19 | 6,14 | 6,38 | 6,19 | 6,30 | 6,01 |
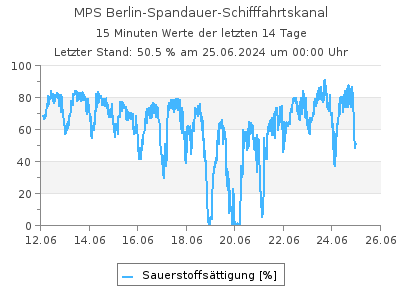
Aktuelle Werte Sauerstoffsättigung als Tabelle
Letzter Tagesmittelwert (30.07.2026): 91,0 %Werte Sauerstoffsättigung in % im Intervall von 2 Stunden (in MEZ), Quelle: Land Berlin
| 00:00 | 02:00 | 04:00 | 06:00 | 08:00 | 10:00 | 12:00 | 14:00 | 16:00 | 18:00 | 20:00 | 22:00 | |
|---|---|---|---|---|---|---|---|---|---|---|---|---|
| 01.08.2026 | 105 | - | - | - | - | - | - | - | - | - | - | - |
| 31.07.2026 | 88,1 | 65,4 | 83,6 | 58,0 | 103 | 109 | 120 | 130 | 133 | 139 | 126 | 123 |
| 30.07.2026 | 72,5 | 61,4 | 70,0 | 86,5 | 85,9 | 93,1 | 101 | 107 | 111 | 115 | 106 | 94,6 |
| 29.07.2026 | 51,6 | 46,2 | 48,8 | 67,7 | 68,0 | 77,9 | 78,7 | 82,0 | 88,5 | 86,7 | 87,6 | 72,3 |
| 28.07.2026 | 40,7 | 21,0 | 32,7 | 49,4 | 58,7 | 68,7 | 70,2 | 68,7 | 70,9 | 70,0 | 60,7 | 62,2 |
| 27.07.2026 | 50,6 | 58,0 | 56,2 | 59,9 | 61,4 | 66,4 | 53,0 | 43,8 | 42,2 | 46,1 | 49,9 | 45,6 |
| 26.07.2026 | 43,7 | 33,8 | 17,9 | 13,5 | 65,1 | 66,9 | 69,3 | 68,1 | 65,9 | 64,0 | 59,8 | 50,4 |
| 25.07.2026 | 49,4 | 22,5 | 17,0 | 60,2 | 49,6 | 65,4 | 68,8 | 69,4 | 71,6 | 69,5 | 70,6 | 67,2 |
| Messstellennummer | 601 |
|---|---|
| Messstellenname | MPS Berlin-Spandauer-Schifffahrtskanal |
| Gewässer | Berlin-Spandauer-Schifffahrtskanal |
| Betreiber | Land Berlin |
| Messstellenausprägung | Online-Messstelle |
| Flusskilometer | 9.08 |
| Rechtswert (UTM 33 N) | 387757.83 |
| Hochwert (UTM 33 N) | 5822226.26 |
Als Favorit speichern Als Favorit entfernen
Durch die Liste der Wasserstand-Messstellen blättern: